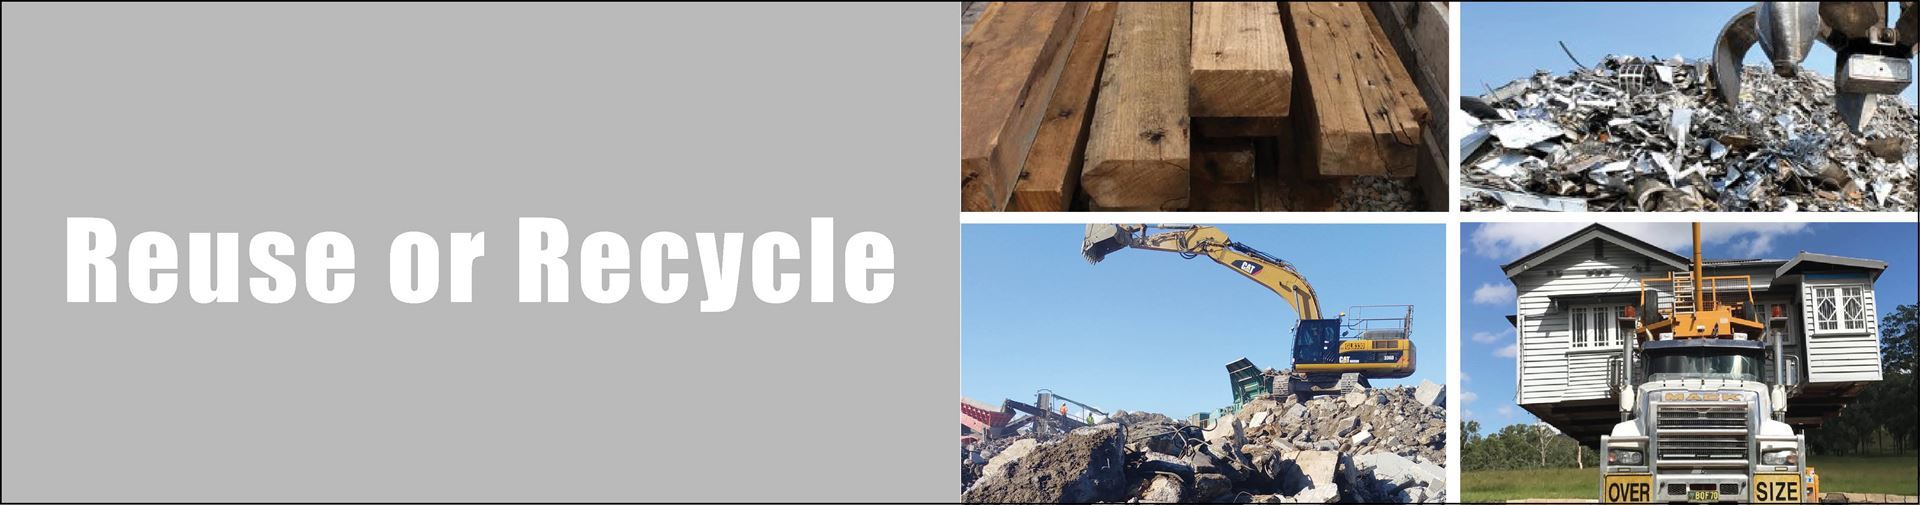
Smarter demolition, better recovery, less landfill
Reuse and recycling should always come before disposal. In the demolition and deconstruction sector, that can mean whole-building relocation, asset recovery, selective deconstruction, and on-site separation of materials for reuse or recycling. The least preferred outcome remains full demolition followed by landfill disposal — commonly known as “crunch and dump”.
9.81 million tonnes
Waste generated in Queensland in 2023–24
57% recovery rate
Overall Queensland waste recovery in 2023–24
83.3% diverted from landfill*
C&D waste diversion in 2023–24
*The demolition and C&D recovery of 83.3% is significantly greater than the overall state recycling rate of 57%
80.6% recycled in Queensland
Of recovered materials processed within Queensland in 2023–24
Recovered materials recycled within Queensland
Queensland’s latest waste data shows strong progress, particularly in construction and demolition (C&D) waste. In 2023–24, Queensland generated 9.81 million tonnes of waste, recovered 5.60 million tonnes, and achieved an overall recovery rate of 57.1%. Even so, more than 4.2 million tonnes still went to landfill. The C&D sector is now Queensland’s strongest-performing waste stream. In 2023–24, 83.3% of C&D waste was diverted from landfill, well above the current 2025 target of 75%. This is a substantial improvement from 2017–18, when the C&D diversion rate was 50.9%. This progress has been driven by large-scale recovery of heavy materials such as concrete, asphalt and masonry. However, mixed and co-mingled materials, especially bulky lightweight waste, still too often go straight to landfill. That makes reuse, source separation and better recovery planning more important than ever.
Construction and Demolition Waste Materials Recovered
| Material | 2023–24 recovered (tonnes) |
|---|---|
| Concrete | 1,600,000 |
| Asphalt | 235,000 |
| Concrete washout | 230,000 |
| Bricks and pavers | 85,000 |
| Fibre cement | 46,000 |
Figures rounded from the latest Queensland Government reporting.
Then vs Now — Queensland Waste Performance
| Metric | 2017–18 | 2023–24 |
|---|---|---|
| Total waste generated | 10.9 million tonnes | 9.81 million tonnes |
| Total waste recovered | 4.9 million tonnes | 5.60 million tonnes |
| Total waste landfilled / disposed | 6.0 million tonnes | 4.2 million tonnes |
| Overall recovery rate | 45% | 57.1% |
| Household / MSW diversion rate | 32.4% | 28.3% |
| Commercial & Industrial diversion rate | 47.3% | 54.6% |
| Construction & Demolition diversion rate | 50.9% | 83.3% |
2017–18 figures are shown as published baseline values; 2023–24 figures are the latest available official data.
Why this matters
Queensland has shown that strong recycling outcomes are possible when the right recovery pathways exist. Concrete alone made up more than half of all recovered C&D material in 2023–24, confirming that established markets for dense, high-volume materials are already delivering results. The next opportunity is to improve recovery of materials that are harder to sort, separate and market.
That means placing greater emphasis on:
- reuse before demolition
- selective deconstruction
- on-site source separation
- reducing mixed waste to landfill
- supporting recycled-content products in construction
Moving forward
For the demolition and deconstruction industry, the direction is clear: reuse first, recover what can be recycled, and send as little as possible to landfill. Queensland has already made major gains in C&D recovery. The next step is to build on that progress by designing projects for better material recovery from the outset.